
Funding arbitrage, after every cost.
Funding rates from 21 exchanges and native order books from 18, recalculated every 1–2 minutes. Each leg is estimated at the visible order-book average price for $10,000, with all four fees and slippage deducted — then it estimates how many hours to break even.
Free to browse · No orders placed · Not investment advice
 Deribit →
 Recreated interface with illustrative numbers — not live data, not a forecast.
Venues covered
Sample dataRecent typical values; the app shows the current figures.
How it works
From raw quotes to a ranked, costed route
Three stages, running continuously. A slow exchange never holds up the others.
Collect
- Each exchange runs in its own lane with its own timeout
- Funding rates, settlement clocks and native order books
- Stale data is labelled stale — never passed off as fresh
Measure
- VWAP against native order books at your full size per leg
- Four fees: open and close on both legs
- Both legs aligned to the same coin quantity
Hummingbird Engine
- Reads 7 days of settlement history
- Picks the top 5 with written reasons
- A new real loss takes a pick down
Demo
See it in under two minutes
Hummingbird Picks
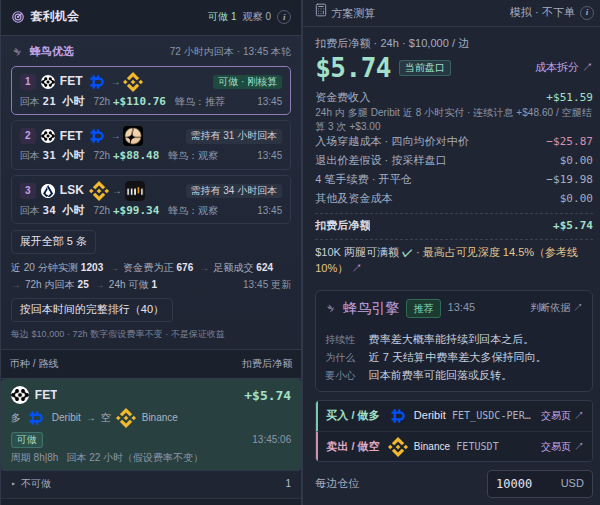
Five routes worth a look, with the reasons written down
Every 5 minutes the Hummingbird Engine reviews measured routes against 7 days of settlement history and picks up to five.
- Each pick states persistence, why, and what to watch out for
- Original timestamps are kept — an old pick is never shown as new
- Withdrawn as soon as a real loss or fill failure appears
A newer measurement showed a real loss at your size. The 13:45 judgment stays readable with its original time, but it is no longer a current recommendation.
+$7.83 → −$12.40
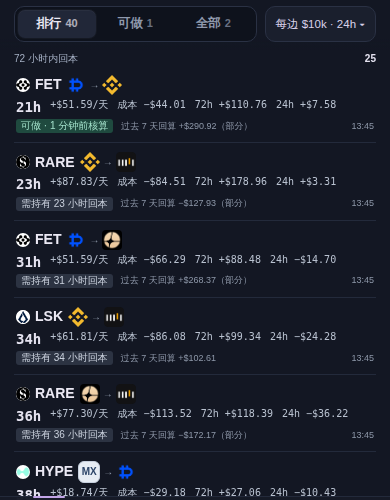
Break-even ranking
Ranked by estimated hours to break even, refreshed every minute
Every route shows daily funding income, entry and exit costs and the 72-hour expected net — so you compare the result, not the headline rate.
- Default $10,000 per leg; change it to your own size
- Your amount is never silently shrunk to make a route look fillable
- Routes that need longer to recover are labelled as such
Market rate table
Every venue’s funding on one scale
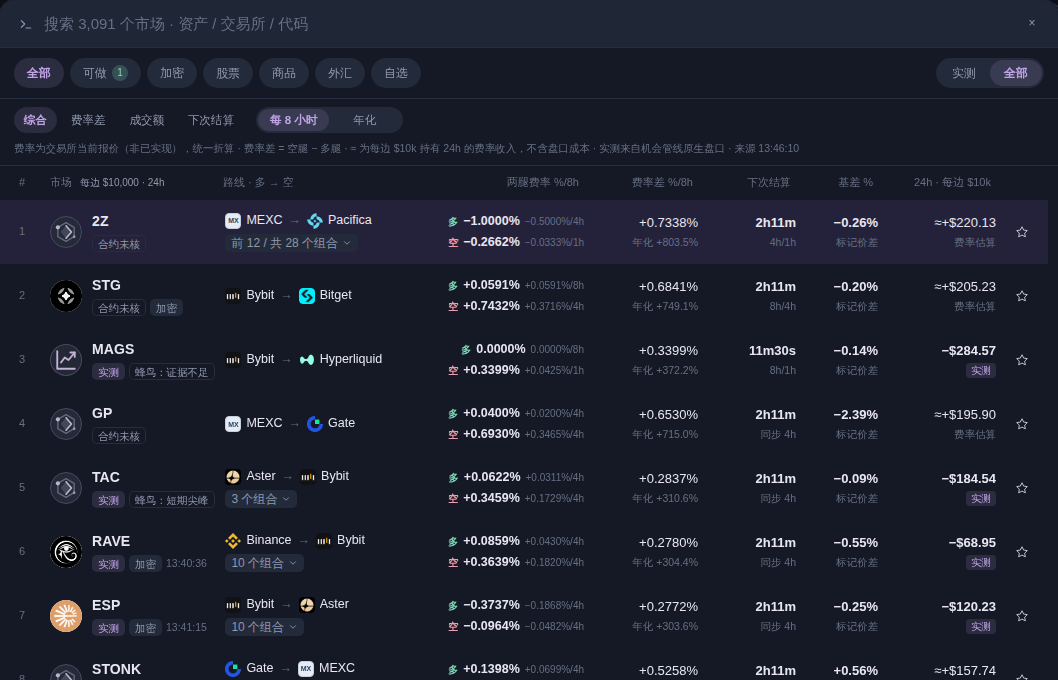
Exchanges settle every 1h, 4h or 8h. The table converts everything to %/8h or annualised so you can compare like for like.
- Next settlement countdown and whether both legs settle in sync
- Labels separate measured routes from rate-only estimates
- Stability tags flag short-term spikes and thin evidence
Search
Type any coin, get both legs and the net
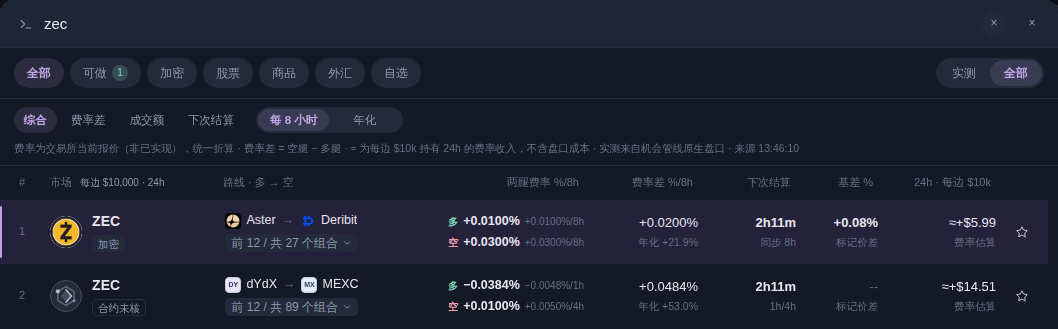
Search across thousands of markets by asset, exchange or ticker. Each result lists the long and short venues, both rates, the spread, basis and a 24-hour estimate at $10k per leg.
- Keyboard-first: ↑↓ to select, Enter to open
- Expand to see every exchange combination for a coin
ZEC
Mobile
The same numbers in your pocket
Opportunities, markets, charts and the calculator — four tabs, built for one hand.
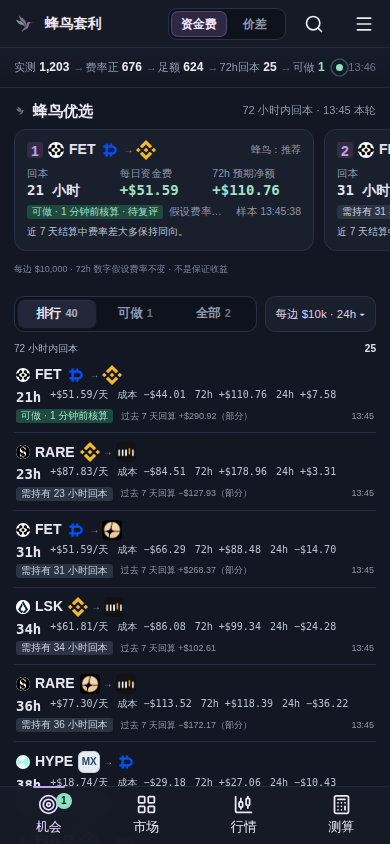
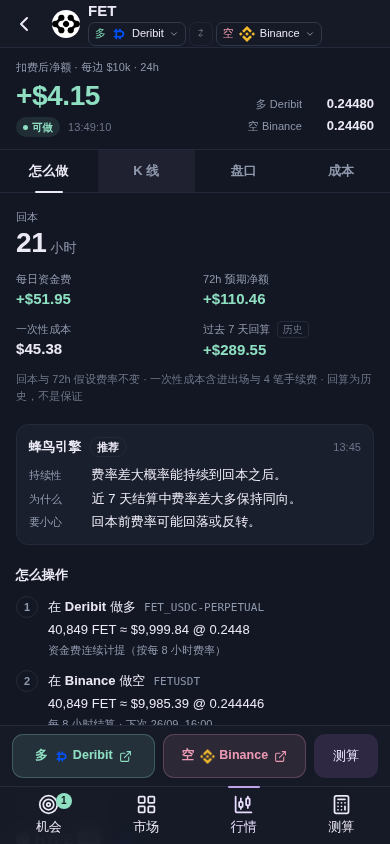
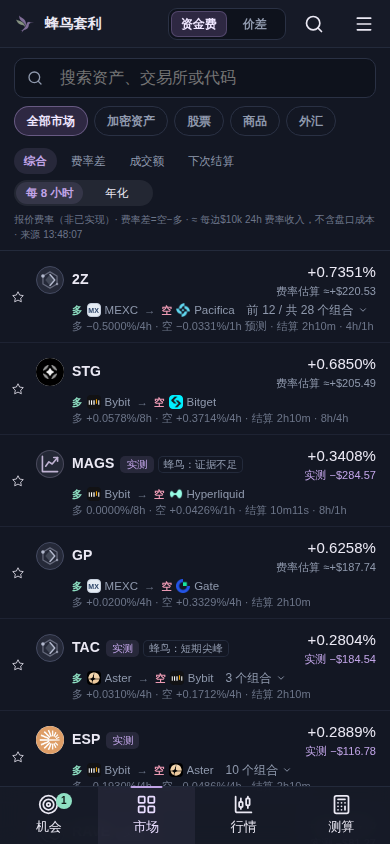
Real interface
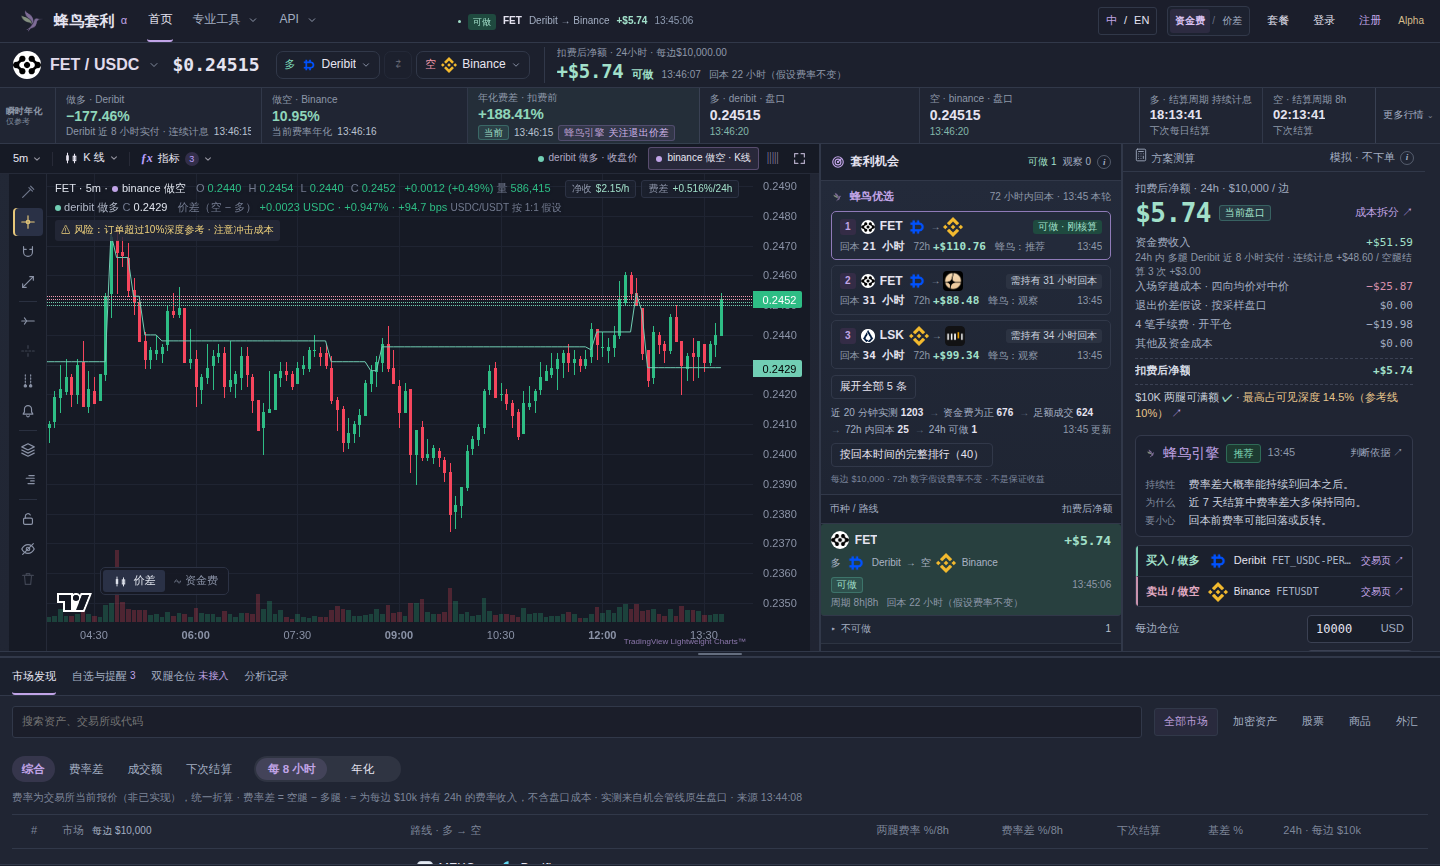
Screenshots from the actual app
The animations above are recreations. These are unedited captures of the current app (figures as of capture time).
FAQ
Frequently asked questions
Is this investment advice?
No. Hummingbird is a calculation tool built on public market data. It does not place orders, hold funds or guarantee any return. Every figure is a simulated estimate for reference only — a scenario for you to verify.
What is funding-rate arbitrage?
Buy (long) a perpetual contract on the exchange with the lower funding rate and sell (short) the same quantity of the same asset where the rate is higher. The two legs largely offset price moves, and you collect the difference in funding. It is not risk-free: rates change or flip, and spreads, fees and slippage can turn the result into a loss.
How is the net after costs calculated?
Each leg takes your full amount (default $10,000) through the exchange’s own order book, giving four average fill prices (VWAPs) for entry and exit. The net is the funding income for the chosen horizon (default 24 hours, estimated at current rates) minus the crossing cost of those four VWAPs against the mid price and the four trading fees (open and close on both legs). Break-even time = total costs ÷ daily funding income.
What if an order book can’t fill my amount, or the data is stale?
The route is marked unverified and is never shown as profitable, and your amount is never shrunk to make it fit. Earlier judgments keep their original time; a newer measurement with a real loss or a fill failure withdraws them.
Where does the data come from?
Funding rates, settlement clocks and order books come from each exchange’s public API. CoinGlass supplies reference market data, and charts are drawn with TradingView Lightweight Charts.
Does it cost anything?
Browsing is free: the ranking, the rate table, Hummingbird Picks, and the net after costs and payback time for the default scenario ($10,000 per leg) are visible without an account. The full cost breakdown, custom amounts, settlement history and the 7-day backtest need a free sign-in with Google, X or email. API access is a paid plan — see Plans & access.
Which exchanges are supported?
Binance, Bybit, OKX, Bitget, Gate, KuCoin, MEXC, BingX, Hyperliquid, Aster, Lighter, GRVT, ApeX, edgeX, Paradex, dYdX, Deribit, Extended, Pacifica, GMX and LBank.
How often is it updated?
The break-even ranking is recalculated every minute from the latest measurements; order-book measurement of each route runs about every 2 minutes. Hummingbird Picks are reviewed every 5 minutes. Every figure carries the time it was measured.
See what’s left after costs
All figures are calculations from public data at the time shown. They are not investment advice and do not guarantee returns. Funding rates change; past settlements do not predict future ones.